Monitoring TrueConf Server with Zabbix
Monitoring of corporate servers is a convenient way to track performance and detect faults.
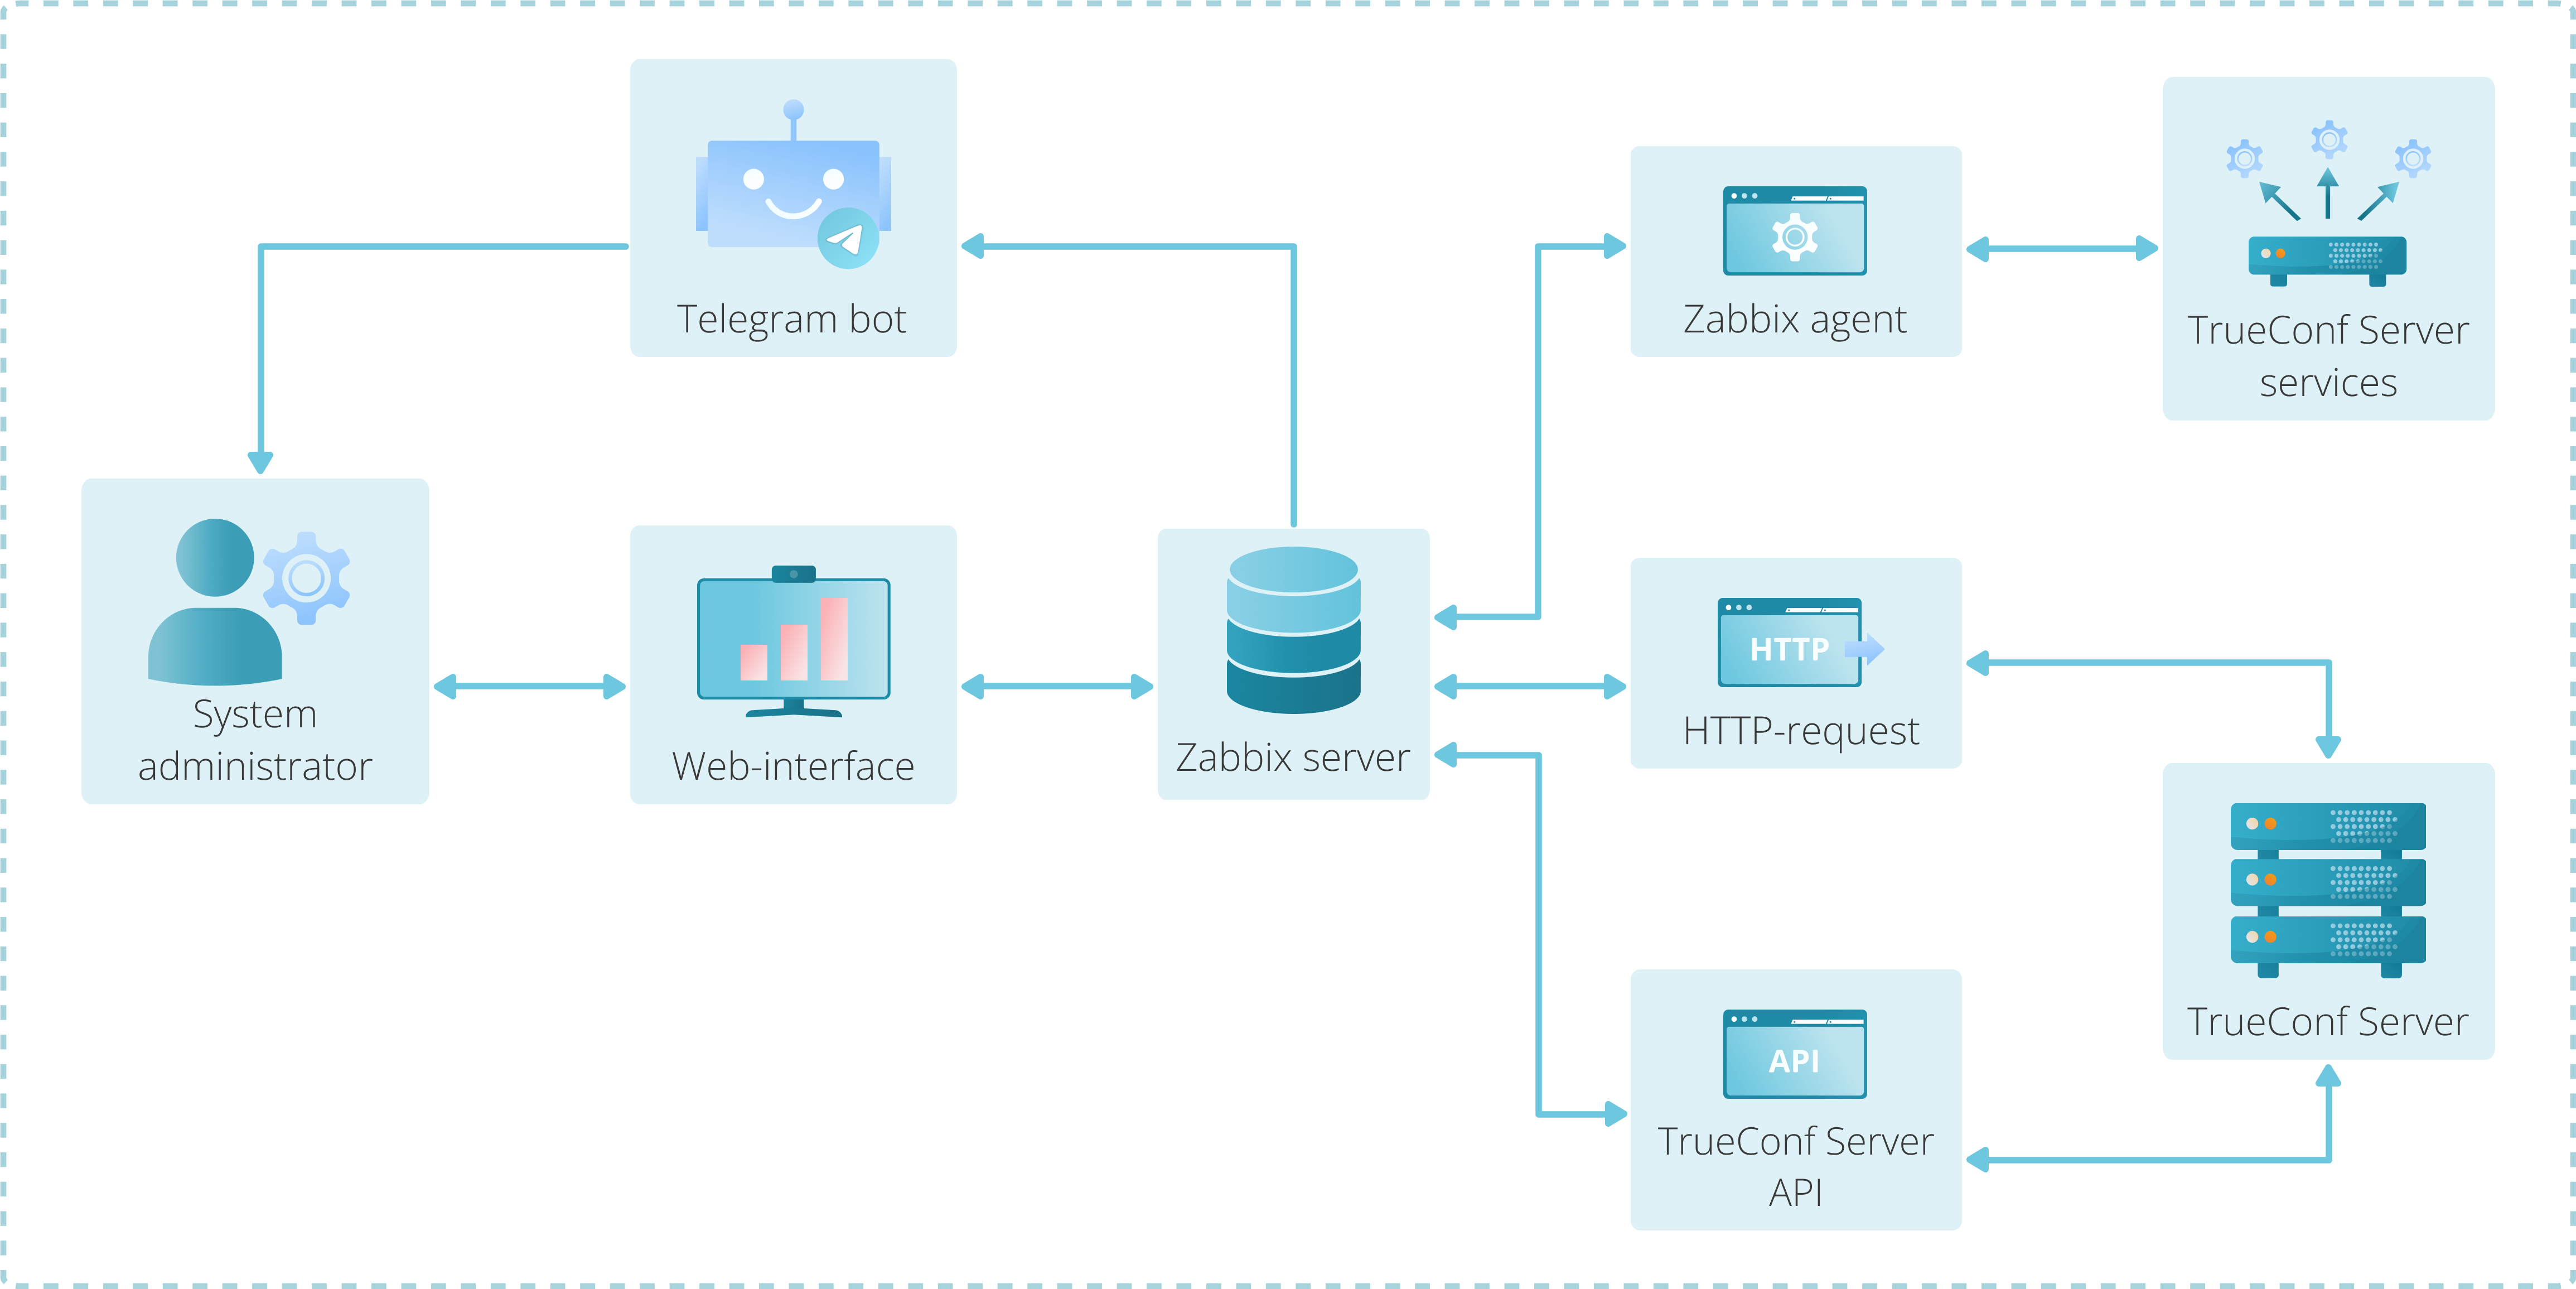
In this article, we will show how the monitoring system of TrueConf Server works by integrating Zabbix. Here, we will monitor the performance of the machine where TrueConf Server is installed, get necessary information about conferences, and send notifications via a Telegram bot. Components:
- TrueConf Server (the system to be monitored);
- Zabbix (monitoring tool).
The monitoring workflow is as follows:
Description of Zabbix and TrueConf API features
Zabbix is a system for monitoring the statuses of various computer network services, servers, network equipment, and other system nodes. Zabbix makes it possible to track the operational state of various components, such as:
- Networks;
- Servers;
- Cloud resources;
- Applications;
- Services.
This solution is popular among system administrators because of its flexible configuration and scalability which supports monitoring of various systems (from “smart homes” to corporate environments). Zabbix ensures the reliability and security of confidential information by encrypting traffic.
A critical feature of this solution is the ability to interact with third-party APIs, in our case with TrueConf API. It will allow you to extract and process data from selected services at the software level.
TrueConf Server provides a RESTful API. With its help, you can manage many parameters of the video conferencing server and retrieve various data. You can learn more about TrueConf Server API in the TrueConf knowledge base.
Integration setup for TrueConf Server API and Zabbix
As an example, let us consider the system consisting of two different servers: the first one where TrueConf Server is installed and the other one with Zabbix. Please note that both solutions can be installed on a virtual machine. The following data will be sent from TrueConf Server to Zabbix::
- Server status;
- Number of ongoing conferences;
- Number of participants in all ongoing conferences.
When reading data about conferences in the TrueConf Server control panel, please keep in mind that:
- If the value in the Participants column is set to 0, the conference started but no one joined it. The conference ends automatically after 100 seconds.
- If there is at least one participant in the conference and all other participants have already left, the conference will end immediately after the last participant leaves.
- If the conference is active, the End field remains empty.
TrueConf Server configuration
To ensure correct integration, one has to configure all components properly. Let us start with TrueConf Server. You can learn more about its installation in the documentation. TrueConf Server API will be used to implement interaction with Zabbix.
This setup implements RESTful API architecture, and is based on HTTP requests, GET, POST, PUT, and DELETE. The server returns responses in the JSON format.
First, we will need to configure HTTPS in the server control panel in the Web → HTTPS section. On the opened page, set the required parameters in the HTTPS Configuration block. We recommend using a commercial certificate, such as Let’s Encrypt, but self-signed certificates are also allowed.
Downloading and configuration of Zabbix
At this stage, you need to configure Zabbix. This component consists of two parts, the client (which collects data and sends it to the server) and the server (which combines data from all clients into an easily analyzable format). So, we will discuss them separately.
For the server part of Zabbix (Zabbix Appliance), you need to choose a suitable deployment option: installation is available on multiple Linux-based operating systems with the help of ready-made images for various hypervisors (KVM, Qemu, Hyper-V, etc.), and as a Docker container. Go to the download page, choose your option, and follow the instructions for it. For testing purposes, we downloaded the file in the OVF format and deployed the solution in VirtualBox.
When launched, the virtual machine with Zabbix Appliance is started in terminal mode, which is the primary way to interact directly with the server. The web interface is also available and we will use it to configure monitoring of TrueConf Server.
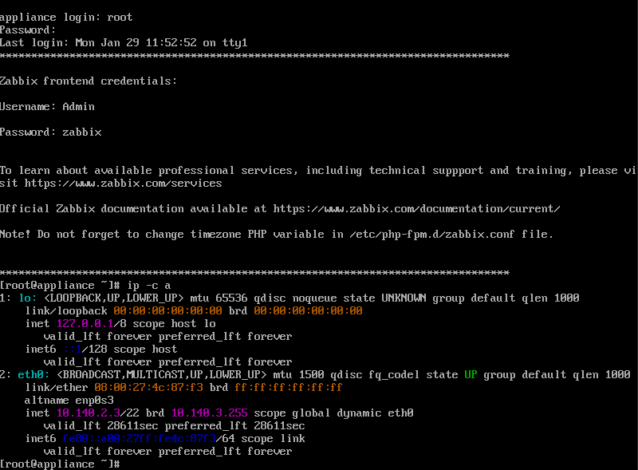
The terminal will request credentials needed for authorization on Zabbix Appliance. Enter the following default credentials:
- Login — root;
- Password — zabbix.
To enhance security, change your password with this command:
passwd (username)
To access the Zabbix Appliance web interface, you need to learn the IP address of the machine. To do it, run the command:
ip -c a
Use the address that you have found to access the Zabbix control panel.
Log in to the web interface with a different username and password. We received them in the section Zabbix frontend credentials after starting the server in the terminal. To log in, enter:
- Username — Admin;
- Password — zabbix.
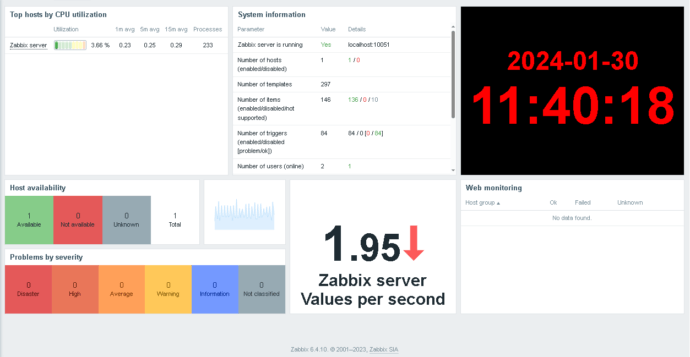
After logging in to the web interface, you will see the dashboard that will include all the necessary information. You can modify and configure widgets for specific tasks.
Downloading and configuration of the Zabbix Agent
The Zabbix Agent is required for integration to work. It allows the server to receive data from the entity which is monitored. Installation of the Zabbix Agent is similar to the Zabbix Appliance: download the appropriate version from the
agent download page and follow the installer instructions.
After installing Zabbix Agent, you need to check if it is working correctly. To do it, go to the Zabbix Appliance terminal and run the following command to connect via TELNET protocol with the command:
|
1 |
telnet agent_ip port |
where:
agent_ip— the IP address of the computer where Zabbix Agent is installed;port— the port to be listened to.
Monitoring
Configuration of monitoring
To configure monitoring of any parameter with the Zabbix Agent, you need to set up the following:
- Host group;
- Host;
- Item.
First, you need to create a host group, a sort of “folder” for grouping hosts by purpose. To do it:
- Go to the section Data collection → Host groups in the web interface panel.
- Click the Create host group button.
- Next, specify the group name (for example, TrueConfServer_agent_group) and click the Add button.
After creating a group of hosts, create the host itself:
- Go to the Data collection → Hosts section.
- In the opened section, click Create host.
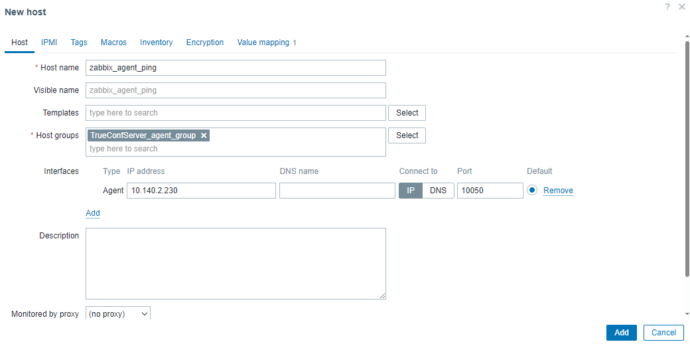
- You will see a pop-up window where one has to fill in the following fields:
- Host name;
- Host groups (select the previously created group — TrueConfServer_agent_group);
- Interfaces (Interfaces → Add → Agent).
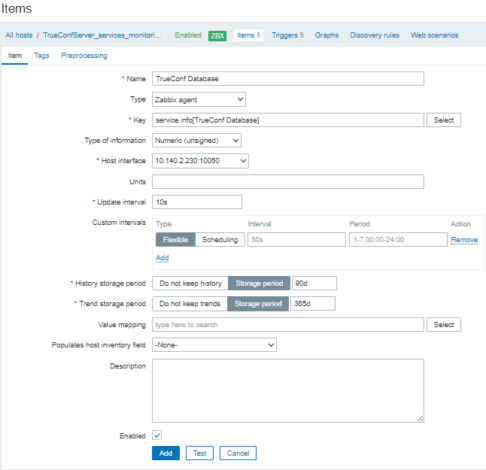
After creating the host, add a data item. In the same Hosts tab, at the bottom, you will see a table with a list of connections. Here, you will need to go to Items → Create item.
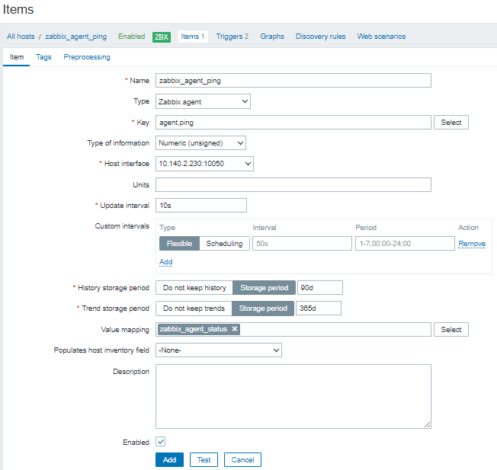
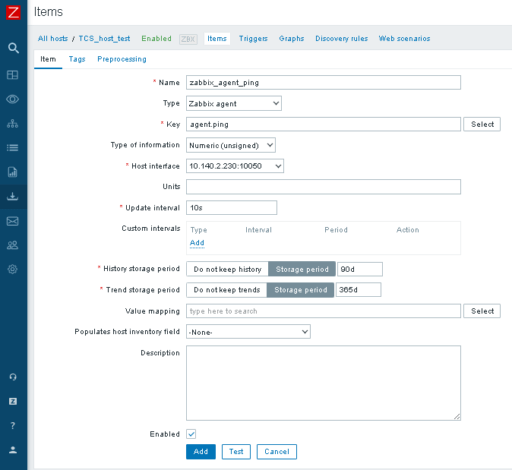
In the pop-up window, fill in the fields:
- Name —
zabbix_agent_ping; - Type —
Zabbix agent; - Key —
agent.ping; - Type of information —
Numeric (unsigned); - Host interface —
10.140.2.230:10050; - Update interval —
10s.
In this case you can use the default values for other parameters. To save the item, click the Add button.
You will see the created element in the list of connections:
Now you can monitor the connection to the machine with TrueConf Server by using the created host. To do it, go to the Monitoring → Lastest data section of the panel, then select the created host zabbix_agent_ping, and click Graph.
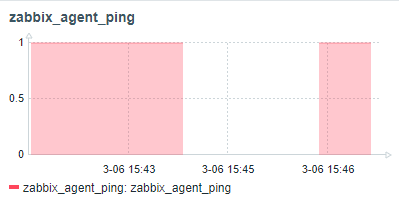
In the opened tab, you will see the chart of the zabbix_agent_ping parameter:
The chart above shows that from 15:44 to 15:46 there was no connection with the server (ping failed).
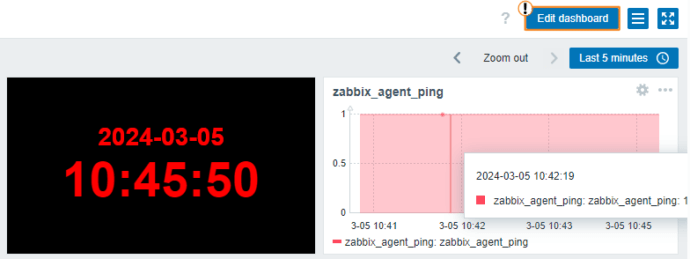
For more convenient data tracking, display the chart in the dashboard of the Zabbix Appliance web interface. To switch to edit mode, click on Edit dashboard in the upper right corner of the dashboard.
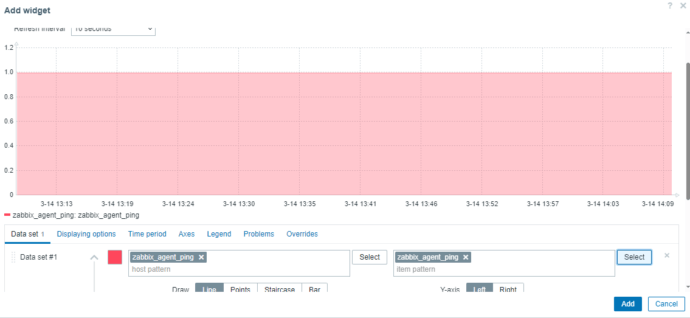
To add a widget:
- Click on the empty area in the panel, the window for adding a widget will open.
- Select the type of widget, in our case a graph (Type → Graph).
- Choose the necessary data for monitoring (in this example, you need to select Host → zabbix_agent_ping → Item → zabbix_agent_ping).
You can adjust the widget display settings, such as the data that should be displayed, graph type, color, transparency, thickness, and others.
As a result, we can see the zabbix_agent_ping, graph, configured for convenient display on the dashboard.
Monitoring TrueConf Server services
The next step is to set up monitoring of all TrueConf Server services with the help of Zabbix. For example, when installing the video conferencing server on Windows, the following services are added:
- TrueConf Server – the main service.
- TrueConf Database – responsible for the database; the operation of TrueConf Server Manager depends on this service.
- TrueConf Web Manager – responsible for the operation of all web interfaces.
- TrueConf Server Manager – the manager for working with the database and configuration files.
- TrueConf Bridge – the service which can receive websocket commands from web applications and convert them into transport messages understandable to TrueConf Server. Additionally, it can interact with the database.
To monitor the status of services, we will create data items again. If you intend to monitor services on Windows, it is important to specify the service name, but not the display name. The service name can be found in the properties of each service (for example, you can open the Services tool by using the command services.msc). Starting from TrueConf Server 5.4, the service name and display name are the same.
The resulting list of services should be:
- TrueConf;
- TrueConf Database;
- TrueConf Web Manager;
- TrueConf Server Manager;
- TrueConf Bridge.
The next step is to implement service monitoring. To do it, follow the example discussed previously and create a data element for each service. For this purpose create the host TrueConfServer_services_monitoring_test, and within it, create data elements. Specify the display name of each service for the sake of convenience:
- TrueConf Server;
- TrueConf Database;
- TrueConf Server Manager;
- TrueConf Web Manager;
- TrueConf Bridge.
The data element is created just as it is shown in the example of zabbix_agent_ping, except for the Key field. In this field, we need to specify service.info[service_name], where service_name — is the name of the service from the list above that should be monitored. As a result, the list of data items looks like this:
For easy monitoring, configure data display in the form of graphs for the created elements and add these graphs to the dashboard. As shown above for zabbix_agent_ping, to add a widget, click on the Edit dashboard button in the upper right corner and select Type → Graph. In this case, you need to specify the following parameters:
- Host pattern — TrueConfServer_services_monitoring_test;
- Item pattern — the service to be monitored.
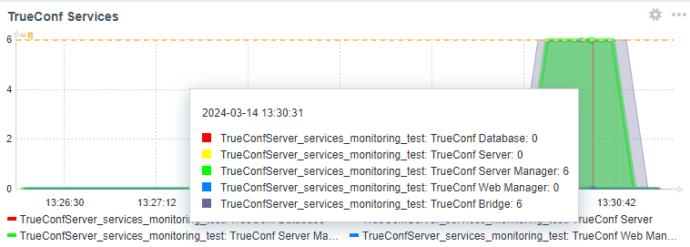
To display the status of TrueConf Server services on the chart, add each data element to a separate data set so that it is possible to select different colors in the chart. Configure the display settings below, click Add, and save your changes to the main panel by clicking Save changes in the upper right corner.
As a result, you will get the chart for monitoring selected services on the main dashboard of the Zabbix Appliance web interface:
Checking access to the server with an HTTP request
Zabbix provides a ready-made component for sending HTTP requests. To monitor the server status with the help of an HTTP request, you will need to create:
- A host with the server’s IP and port number;
- A web scenario.
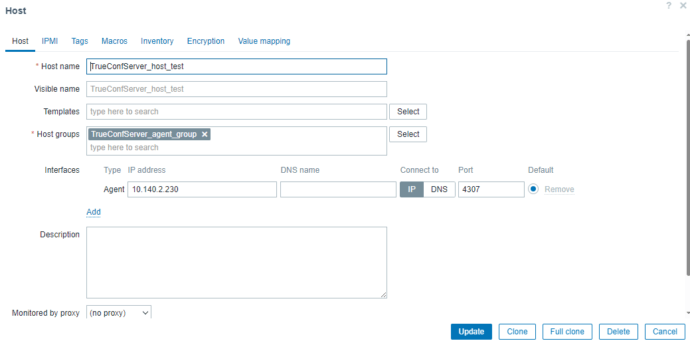
The creation of the node is described above, here is what the result should look like:
In this case, the TrueConf Server IP address is 10.140.2.230, and the port for checking the status with an HTTP request is 4307. To create a web scenario:
- To create a web scenario Data collection → Hosts section.
- In the host row, click Web.
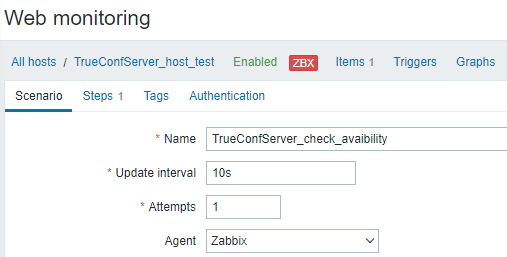
- Create a scenario in the Scenario tab by clicking on Create web scenario.
Fill in the fields:
- Name —
TrueConfServer_check_avaibility; - Update interval —
10s; - Attempts —
1; - Agent —
Zabbix.
Now you need to set the operation (called a step in the context of Zabbix) that should be performed during the scenario. For this purpose, go to the Steps tab and fill in the fields:
- Name —
check_trueconfserver_avaibility; - URL —
http://10.140.2.230:4307/vsstatus/; - Timeout —
10s; - Required status code —
200.
After filling out the form, click Update in the Steps tab. The configured step of the web scenario will look in this way:
To save the scenario, click the Update button in the Scenario.
Here is the complete web scenario:
To test the created scenario:
- Go to the Monitoring → Hosts section in the sidebar.
- Click Web in the TrueConfServer_host_test row.
The table shows that everything is correct which means that the HTTP request is successfully processed:
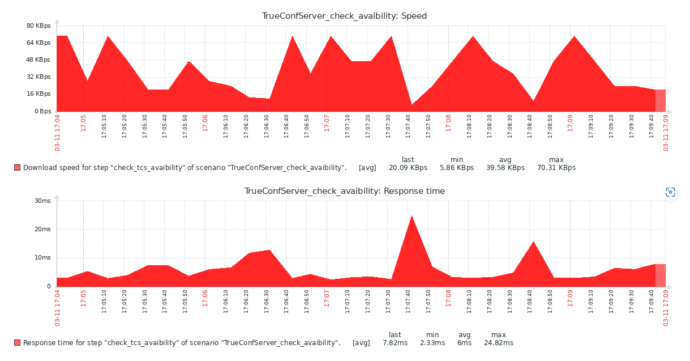
For more detailed information, go to the web scenario by clicking on check_TrueConfServer_avaibility. The following graph will open:
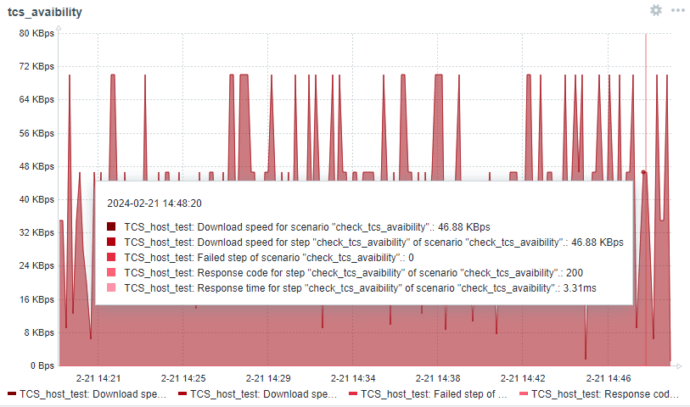
For more convenient monitoring, add the widget to the main screen as shown previously. In the settings, specify the following parameters:
- Type — Graph;
- Data set — Add new data set;
- host pattern → Select — TrueConfServer_host_test;
- item pattern → Select — choose the data you need.
Next, click the Add and Save changes buttons.
Zabbix and TrueConf Server API
Now let us configure the settings that will enable us to get the number of ongoing conferences and their participants via TrueConf Server API. To do it, we need to create a host, retrieve the JSON data with an HTTP request, convert this data into a readable format, and display it on the main dashboard.
You should start by creating a host, as shown earlier. Create a data item (HTTP agent), and form the HTTP request according to the TrueConf Server API documentation.
Use the Get Call List request to receive the list of video conferencing sessions:
|
1 |
https://{{$server_name}}/api/v3.7/logs/calls?access_token={{$access_token}} |
where:
{{$server_name}} — the address of the TrueConf Server;{{$access_token}} — the TrueConf Server token.
For example:
|
1 |
https://10.140.2.230:10066/api/v3.7/logs/calls?access_token=5halVyMDtoT1aoqhOGTDLyERXTN0uRQk |
As a result, you will get this HTTP agent:
The list will include both ongoing and completed video conferencing sessions (see the end_time parameter). Please note that the list will include all types of sessions, both one-on-one calls and group conferences. They differ by the value of the class parameter: for calls, it equals 1. So, to select only conferences, you need to use this condition class != 1 to filter the list. To do it:
- Go to the Preprocessing tab.
- In the Preprocessing steps block, click Add.
- In the first step, specify the following parameters:
- Name : Replace
- parameters :
null → “null” - In the second step, specify the following parameters:
- Name : JSONPath;
- parameters :
|
1 |
$.list[?(@.end_time == 'null' && @.class != 1)].end_time.length() |
This expression is formed according to the official Zabbix JSONPath functionality guide.
As a result, we get a configured data item that returns the number of active conferences.
You can create a data item that returns the number of participants in active conferences in a similar way (don’t forget about the first conversion step: null → “null”). The resulting expression is as follows:
|
1 |
$.list[?(@.end_time == 'null' && @.class != 1)].participant_count.sum() |
Please note that if there are no participants in the conferences, an incorrect value will be displayed on the main panel. To fix this problem, select the option Set value to in the Custom on fail block and enter your explanatory text, such as “No participants”.
As a result, we will get two data items that process the JSON response received via the API and return the number of active conferences and participants in them.
API request verification
Before testing, you should verify the data returned by the API request. To do it, execute this request in the browser:
|
1 |
https://10.140.2.230:10066/api/v3.7/logs/calls access_token=5halVyMDtoT1aoqhOGTDLyERXTN0uRQk |
where:
10.140.2.230:10066— TrueConf Server IP address;5halVyMDtoT1aoqhOGTDLyERXTN0uRQk— TrueConf Server API token.
Here is an example of the JSON data that you may receive:
|
1 2 3 4 5 6 7 8 9 10 11 12 13 14 15 16 17 18 19 20 21 22 23 |
"cnt": 8, "list": [ { "conference_id": "00000015074db9fe@testserver1.trueconf#vcs", "named_conf_id": "906277858941", "topic": null, "class": 1, "type": 0, "subtype": 0, "owner": "testuser4.roman@testserver1.trueconf", "participant_count": 2, "start_time": { "date": "2024-03-07 08:57:59.000000", "timezone_type": 3, "timezone": "Europe/London" }, "duration": 12, "end_time": { "date": "2024-03-07 08:58:11.000000", "timezone_type": 3, "timezone": "Europe/London" } } |
We will need to find required parameters for every conference (list object) in the JSON data:
“end_time”: null— the end time of the conference. An empty value means that the conference is still active. We are interested only in such conferences, and their number should be counted;“class”: 10— a conference type. We will need to check if this value is not equal to 1 (it is necessary to select all types except one-on-one calls);“participant_count”— the number of participants in each conference that meets condition 1.
In the TrueConf Server control panel, you can also track active sessions for conferences and check the number of participants in them. To do it, go to the Reports → Call History section and check the rows where the value in the Mode column differs from a video call.
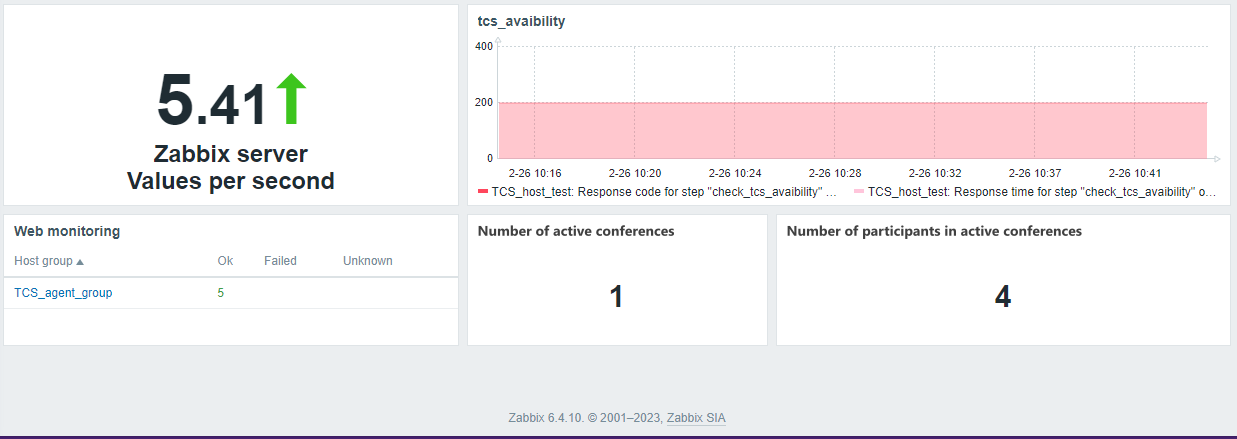
Based on previous examples, we create widgets to display items in the main panel. The result should look like this:
The information which is displayed when making a request in the browser matches the information in TrueConf Server, and on the main panel of the Zabbix Appliance web interface. This means that monitoring is working correctly.
Notifications from the Telegram bot
Next, we need to configure the Telegram bot to receive notifications from Zabbix. For this method to work, one has to have a bot token and ID of the user or group that will receive notifications. The Zabbix Agent collects data about the TrueConf Server services, sends it through the specified host (IP address, port) to the Zabbix Appliance. If any of the triggers configured in Zabbix are activated, notifications will be sent via Telegram.
Creating a Telegram bot
Start by creating a bot:
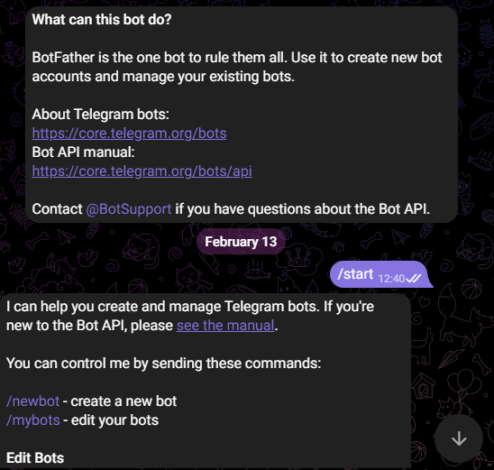
- Find the user BotFather on Telegram and click the Start button in the chat or type the command
/start. - Next, send the command
/newbot. - Come up with a username for the bot so that it can be easily found in the chat list.
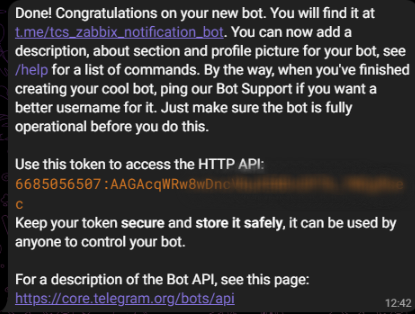
- The bot will reply with a message containing a token needed for managing the Telegram bot.
After creating the bot, check the ID of the user or group to which notifications should be sent. In this example, we will show how notifications can be sent to our Telegram account. To do it, we need to check our ID with the help of the bot. Find the bot ID by typing “ID bot” in the search field, then send the /start command to the bot.
The bot will reply with a message that will include our ID.
Integration of Telegram with Zabbix Appliance
Now let us set up integration with Telegram:
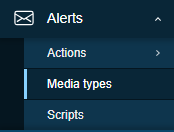
- In the Zabbix Appliance web interface, go to the Alerts → Media types section.
- A table will open, find Telegram in it, and click the Disabled link to enable this notification method. The link text should change to Enabled.
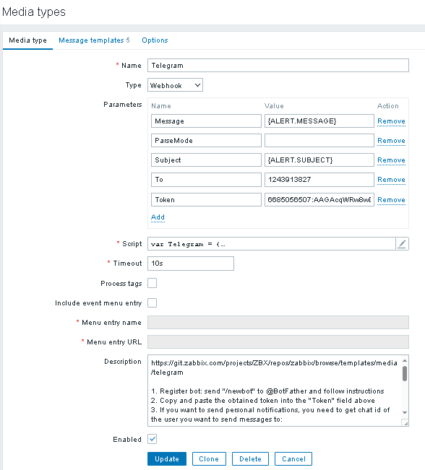
- Next, click on Telegram to go to the settings of this notification type, and specify the following parameters
- Name — Telegram;
- Type — Webhook;
- Message — {ALERT.MESSAGE};
- Subject — {ALERT.SUBJECT};
- To — ID пользователя или группы;
- Token — токен бота Telegram.
- After setting the parameters, click Update to apply changes.
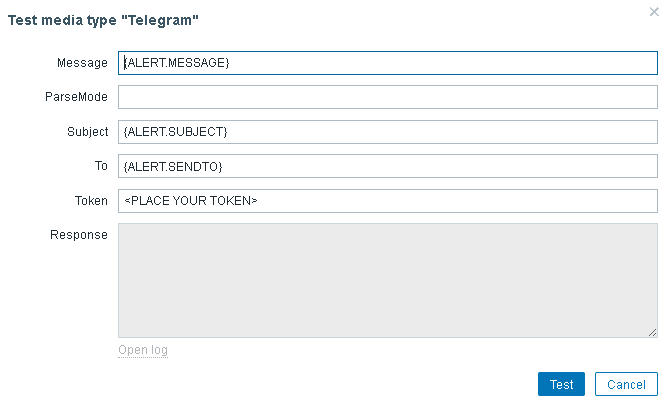
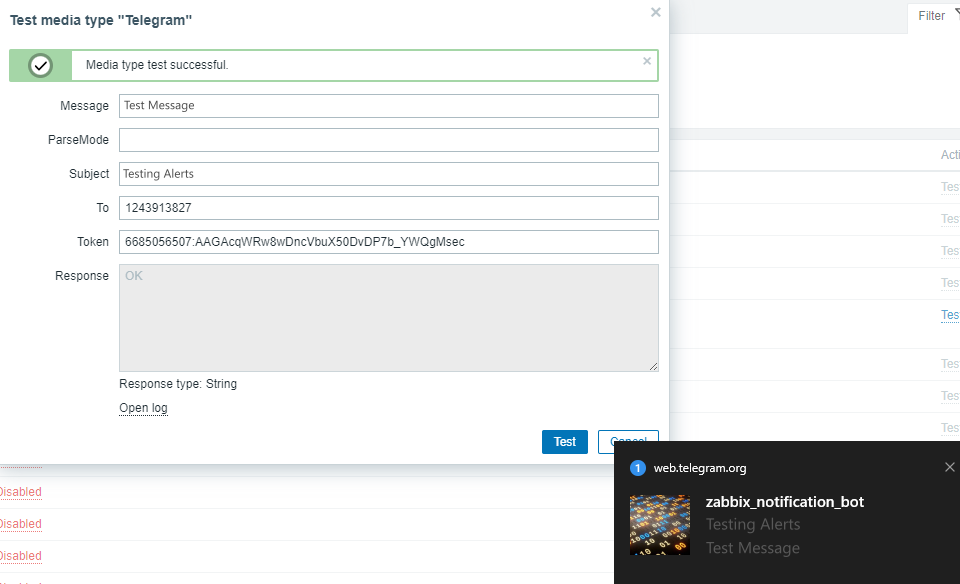
Right after applying changes, check if notifications work correctly by clicking the Telegram button in the Test row.
Fill in the fields:
- Message — message text;
- Parse mode — can be left empty;
- Subject — subject (which component is being discussed, host, service, etc.);
- To — recipient, specify the user or group ID;
- Token — bot token.
After filling out the form, click the Test button, and the Response field will display the test result (error or OK).
If everything is set up correctly, you will receive a message from the bot in Telegram.
All that remains is to set up the sending of all the metrics mentioned above via the Telegram bot. To do it:
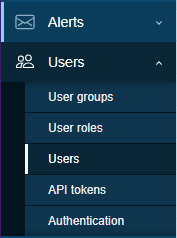
- Go to Users → Users on the sidebar panel.
- Click on the Admin user.
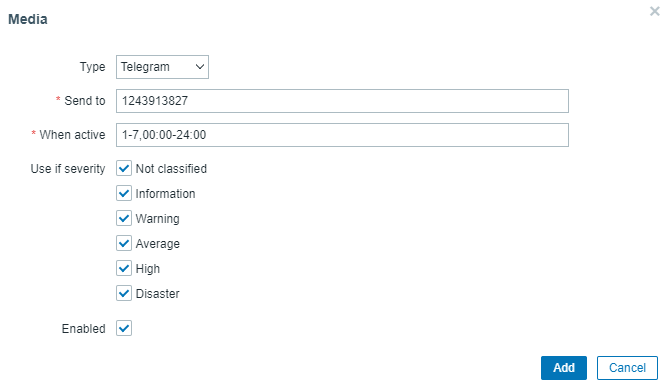
- Go to the Media tab and click Add.
- Fill in the fields in the pop-up window:
- Type — Telegram;
- Send to — (User/Group Telegram ID);
- When active — the time when this notification method should be active;
- Use if severity — the importance of the notification. Set the severity level depending on your case: from a simple notification (Information) to an alert about a serious issue (High, Disaster).
- After filling in all the fields, click Add and then Update.
The final step of setting up the notification system. You need to configure triggers that will respond to changes in the state of selected data items:
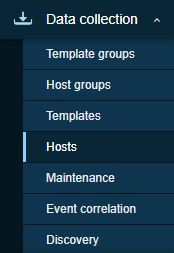
- Click Data collection → Hosts in the sidebar.
- Click TrueConfServer_services_monitoring_test In the row Triggers.
- In the opened tab, click Create trigger.
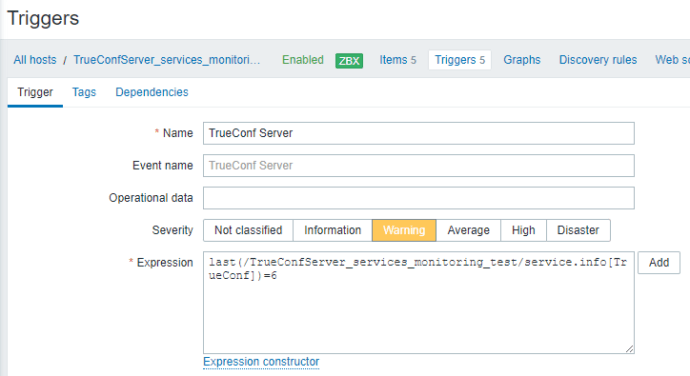
- Set the parameters in the trigger pop-up window:
- Name — TrueConf Server;
- Event name — (Automatically filled after the Name field);
- Severity — Warning;
- Expression — Add.
- Fill the fields in the Condition window:
- Item → Select — TrueConf Server;
- Function — last() – Last (most recent) T value;
- Result — 6 (in our case 6, this code is returned by the function
service.info[service_name]if the service is stopped). - After filling in the fields, click Insert, the expression will be:
last(/TrueConfServer_services_monitoring_test/service.info[TrueConf])=6. - When all fields are filled, click Add.
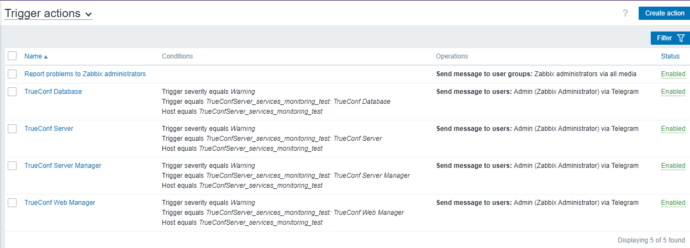
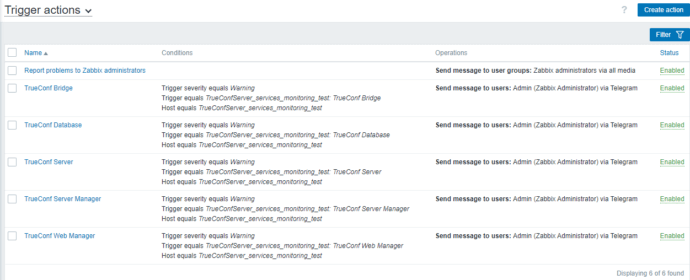
Create triggers for other TrueConf Server services by following the same principle. As a result, you will get the list of triggers:
Next, it is necessary to create a trigger action. To do it:
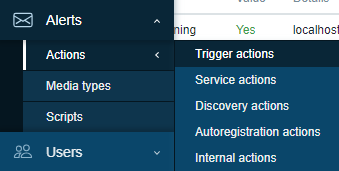
- Go to Alerts → Actions → Trigger actions in the panel.
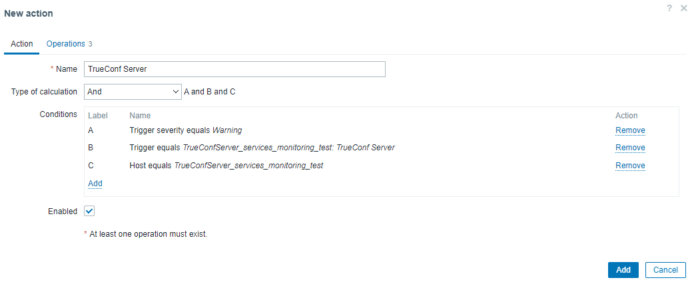
- Click the Create action button to create a trigger action:
- Fill in the fields In the New action pop-up:
- Name — the name of the trigger action;
- Type of calculation — And (the trigger will be activated only if all conditions are met at the same time);
- Conditions — create 3 conditions:
- Host equals TrueConfServer_services_monitoring_test (Connection used for monitoring);
- Trigger equals TrueConfServer_services_monitoring_test: TrueConf Web Manager (Trigger: TrueConf Server service);
- Trigger severity equals Warning (Trigger importance).
- Status — Enabled.
- Next, go to the Operations tab, where one has to configure the actions that should be performed when the trigger is activated:
- Operation (actions that should be performed when the trigger is activated);
- Recovery operation (actions upon recovery);
- Update operation (actions upon update).
- Click Add to add an action.
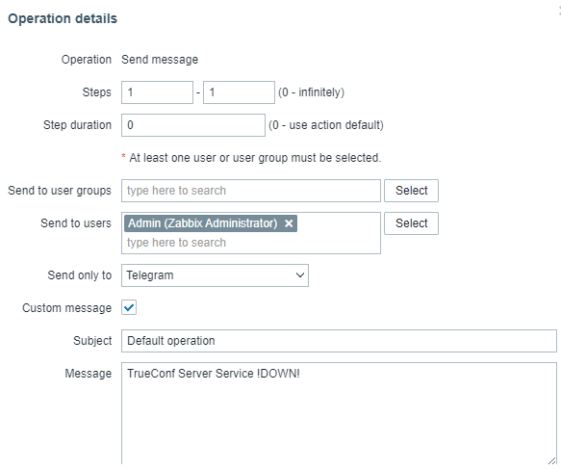
- Fill in the fields in the Operation details window:
- Send to users — Admin;
- Send only to — Telegram.
Leave default values for other fields, then click Add. Similarly, add actions for Recovery and Update operations. The result should look like this:
Testing notifications via Telegram bot
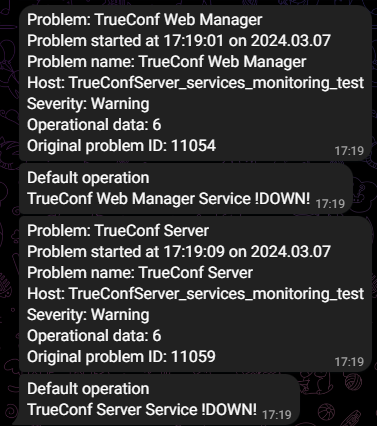
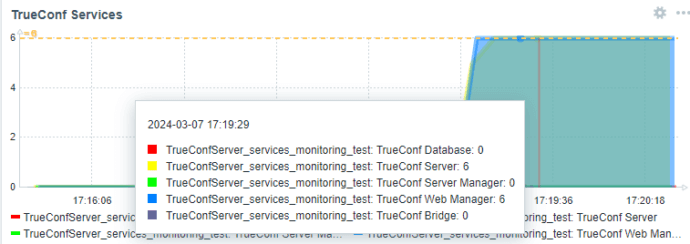
To test the notification system, we stopped the services TrueConf Server and TrueConf Web Manager. The result was as follows:
The Telegram bot sent a notification about the problem. The chart on the main dashboard displays the status of the services:
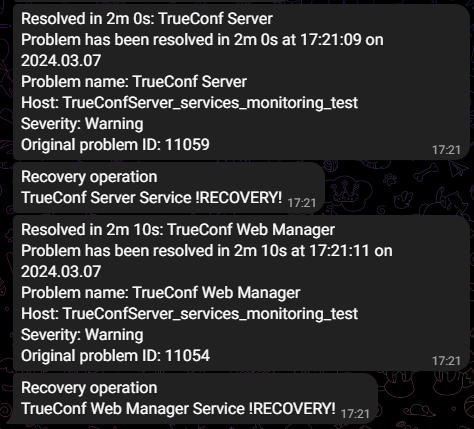
Restart the services, and the Telegram bot will notify you that they have resumed their work.
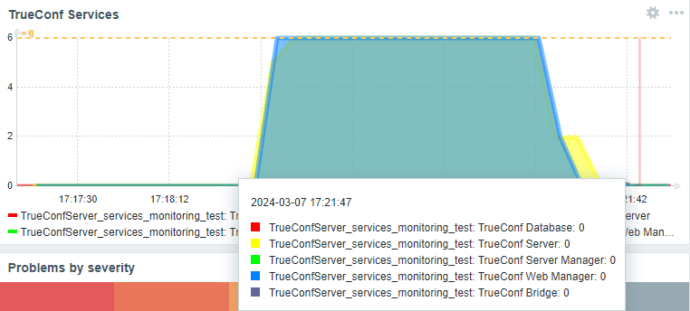
The chart on the main panel also shows that the operation of services has been restored:


